
Ever since CN Annadurai of DMK uprooted INC, the sole dominant party then in 1967 elections, two dominant parties DMK and AIADMK had been alternating in throne for the most time in TamilNadu politics. One exception was December 1984 election when MG Ramachandran of AIADMK, incumbent Chief Minister then, won an absolute majority with 54% vote-share and retained his Chief Minister seat.
Fast forward 30 years, last May, we witnessed another such rarity when incumbent Chief Minister J Jayalalitha held onto her seat despite the anti-incumbency wave (partly from mishandling of floods), new parties mushrooming in the State and no popular party in AIADMK coaliation.
In this data story, we’ll look at votes pattern across constituencies in TN. Along the way, we’ll visualize data through charts and interactive-maps to bring out deeper trends/patterns, which otherwise tend to get missed out in simple summary numbers.
Note: TamilNadu Assebly Election was held in May 2016 in 232 out of 234 seats. Data used in this story was extracted from Election Commission of India website.
Popular Parties!
Let’s start with a quick look at most popular parties in the State by aggregate number of votes received across all constituencies in State.
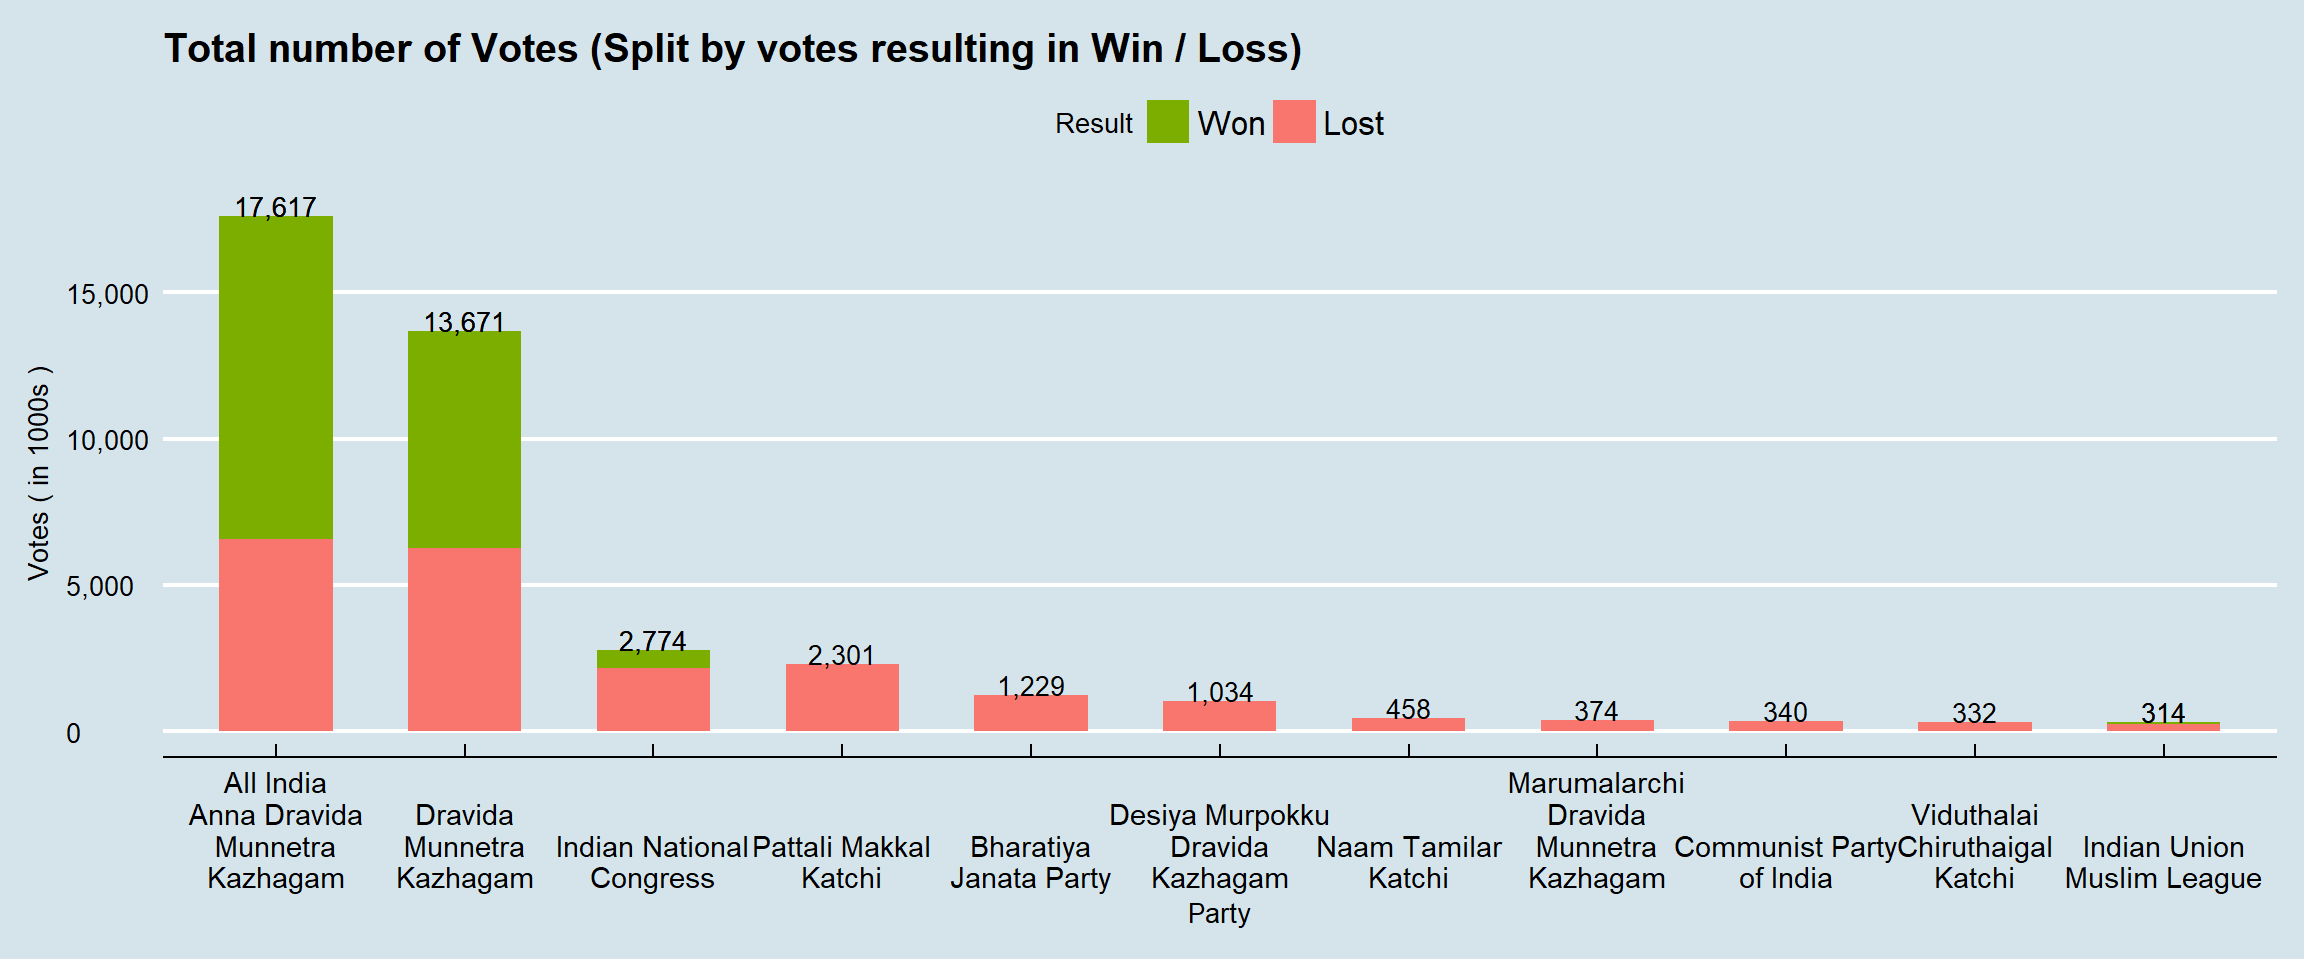
It can be seen that much of AIADMK, DMK votes resulted in Win; whereas in case of INC (and other parties) it’s mostly loss, with votes failing to garner winnable majority at Constituency level. While INC managed to win a few seats, the other trailing parties like PMK, BJP, DMDK etc. had no single win despite having won 1+ million votes overall. In contrast, one party IUML scored only 300K votes overall and still ended up with a win.
Vote-share and Long-Tail
One general observation about TamilNadu is that two dominant parties take huge mind-space of voters in State leaving very little scope for rest. It’s sort of true, as seen in vote-share of top parties vis-a-vis rest of the parties.
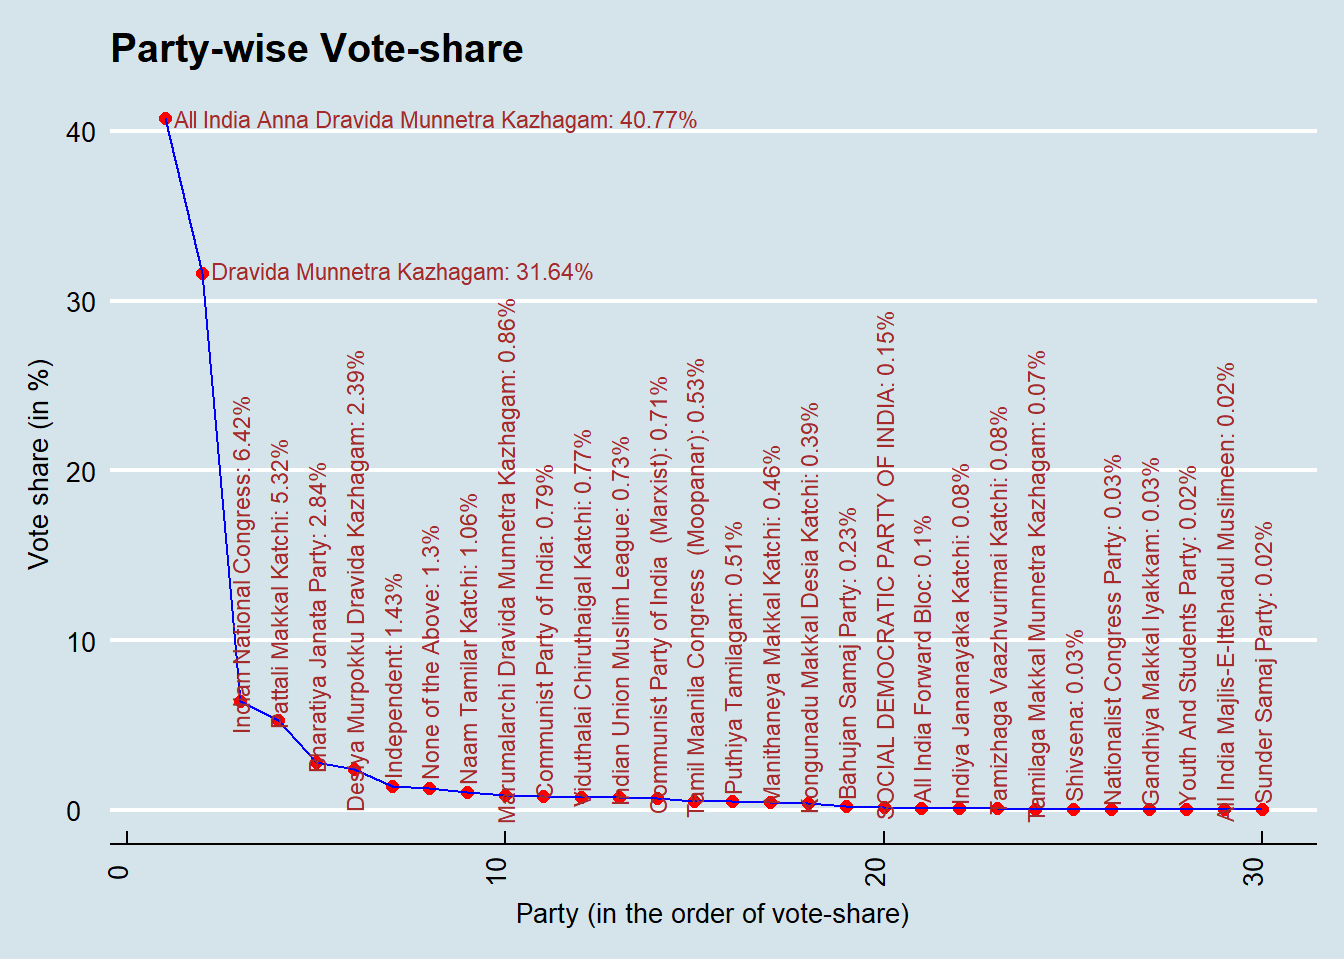
We can see that approx. 75% of vote-share gravitate towards two dominant parties AIADMK and DMK, leaving the rest with abysmal vote-shares (Note: DMK had pre-poll alliance with INC thus not contesting in 40+ shared seats). This long-tail of trailing parties, more often than not, cater to specific aspirations, ideologies, castes etc. thus failing to catch imagination of wider section of voters; this partly contributes to very fragmented voting behavior common among their supporters.
Who won and who lost?
We have seen aggregate number of votes and vote-share, yet what ultimately matters is number of individual seats won. Let’s look at seats contested vs won. (Please note that parties like DMK had seat-sharing with its ally INC, prior to poll thus showing less number of seats contested)
Note: Numbers are as taken from ECI website: ECI website doesn’t list a party with ‘zero votes’ in ‘Results’ section. So when a Party data isn’t there for a Constituency in ECI website, it’s not a straight-forward decision whether the party didn’t contest or contested but got zero votes - here I have considered only the Party-Constituency combinations with non-zero votes.
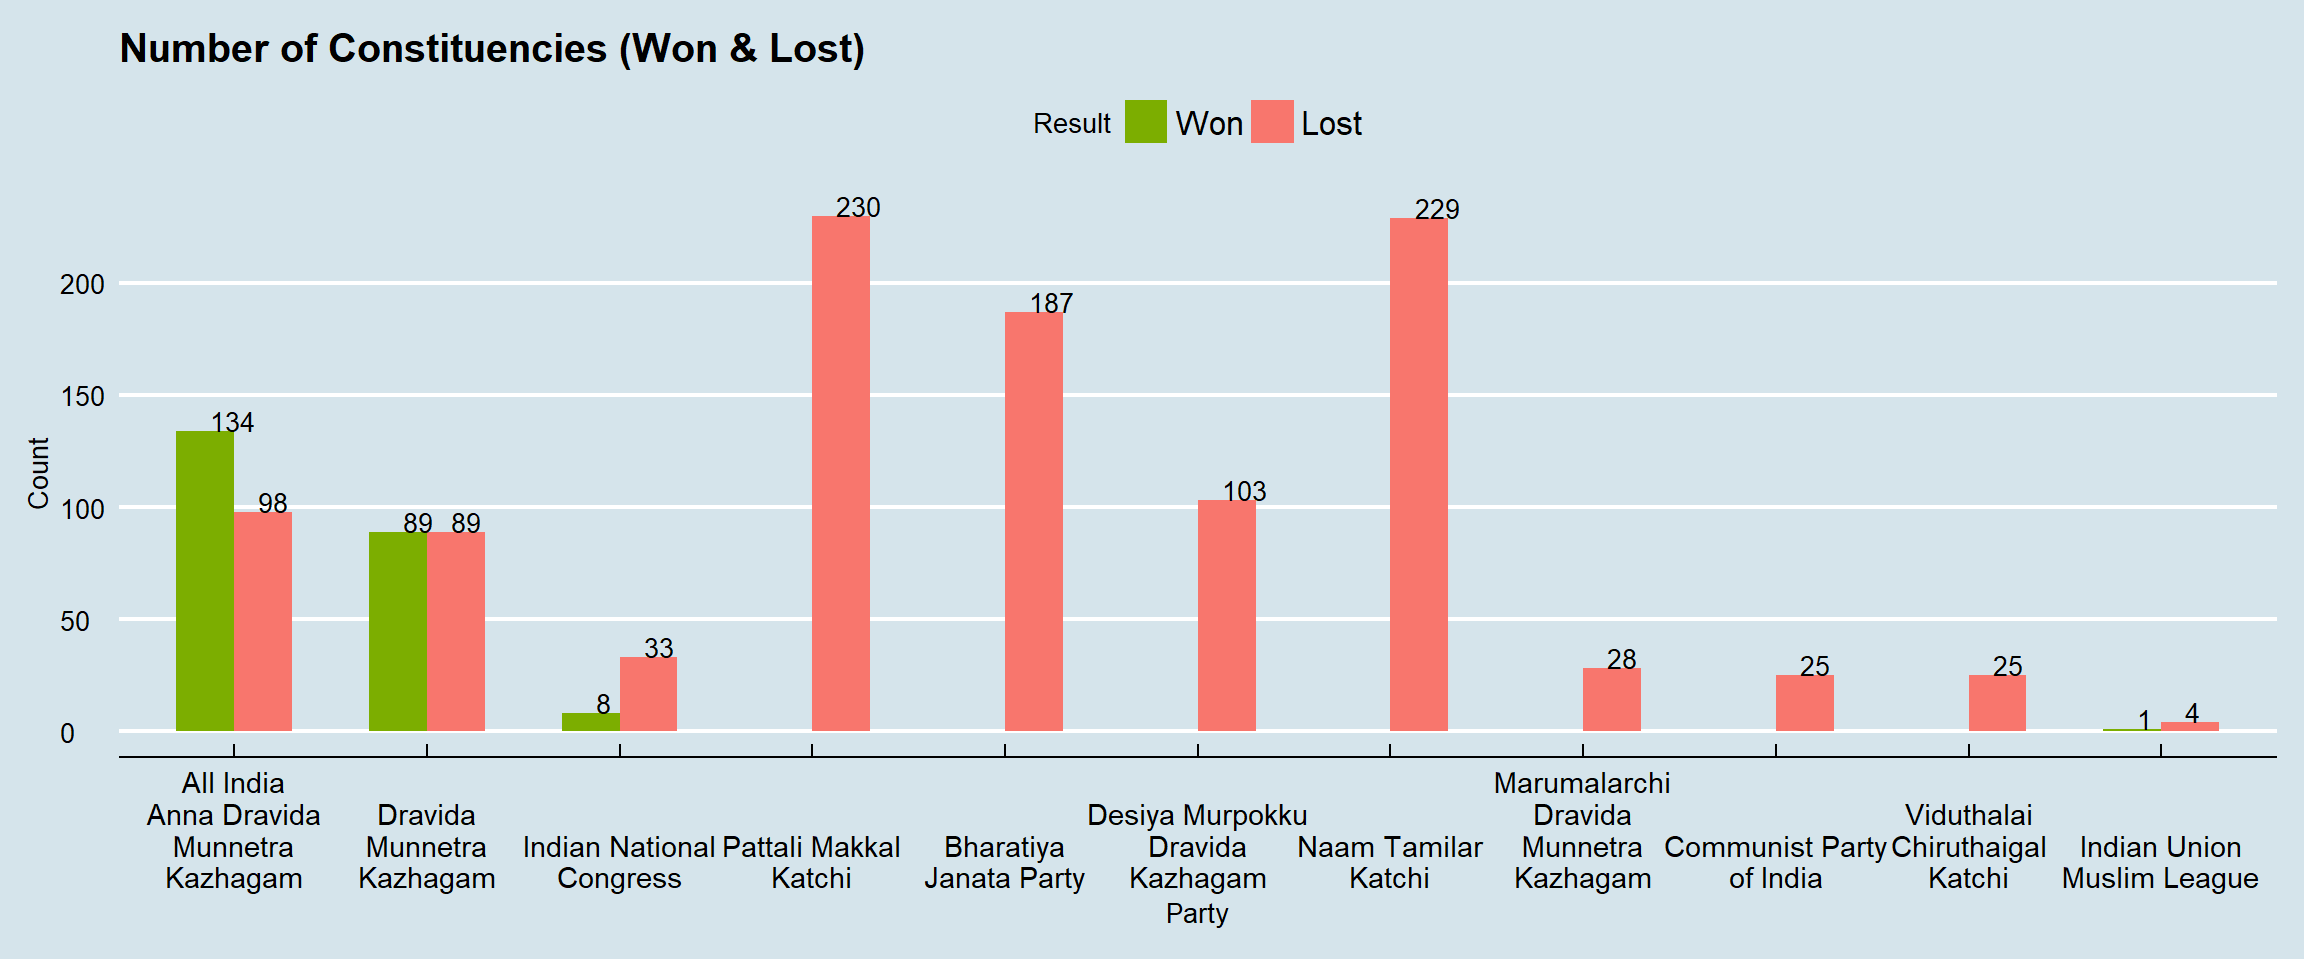
Except for AIADMK and DMK, almost all other parties had a dismal show, losing almost all the seats contested. One exception is IUML which won 1 out of 4 seats it contested - this again stresses the need for depth and penetration in a few constituencies rather than shallow reach across many constituencies.
Who lost their deposits?
As per ECI rule, parties which don’t get more than one-sixth of votes polled in Constituency, shall forfeit their deposit. Losing deposit is a big negative mark on party’s reputation and at times, even makes the party-workers doubt their loyalties.
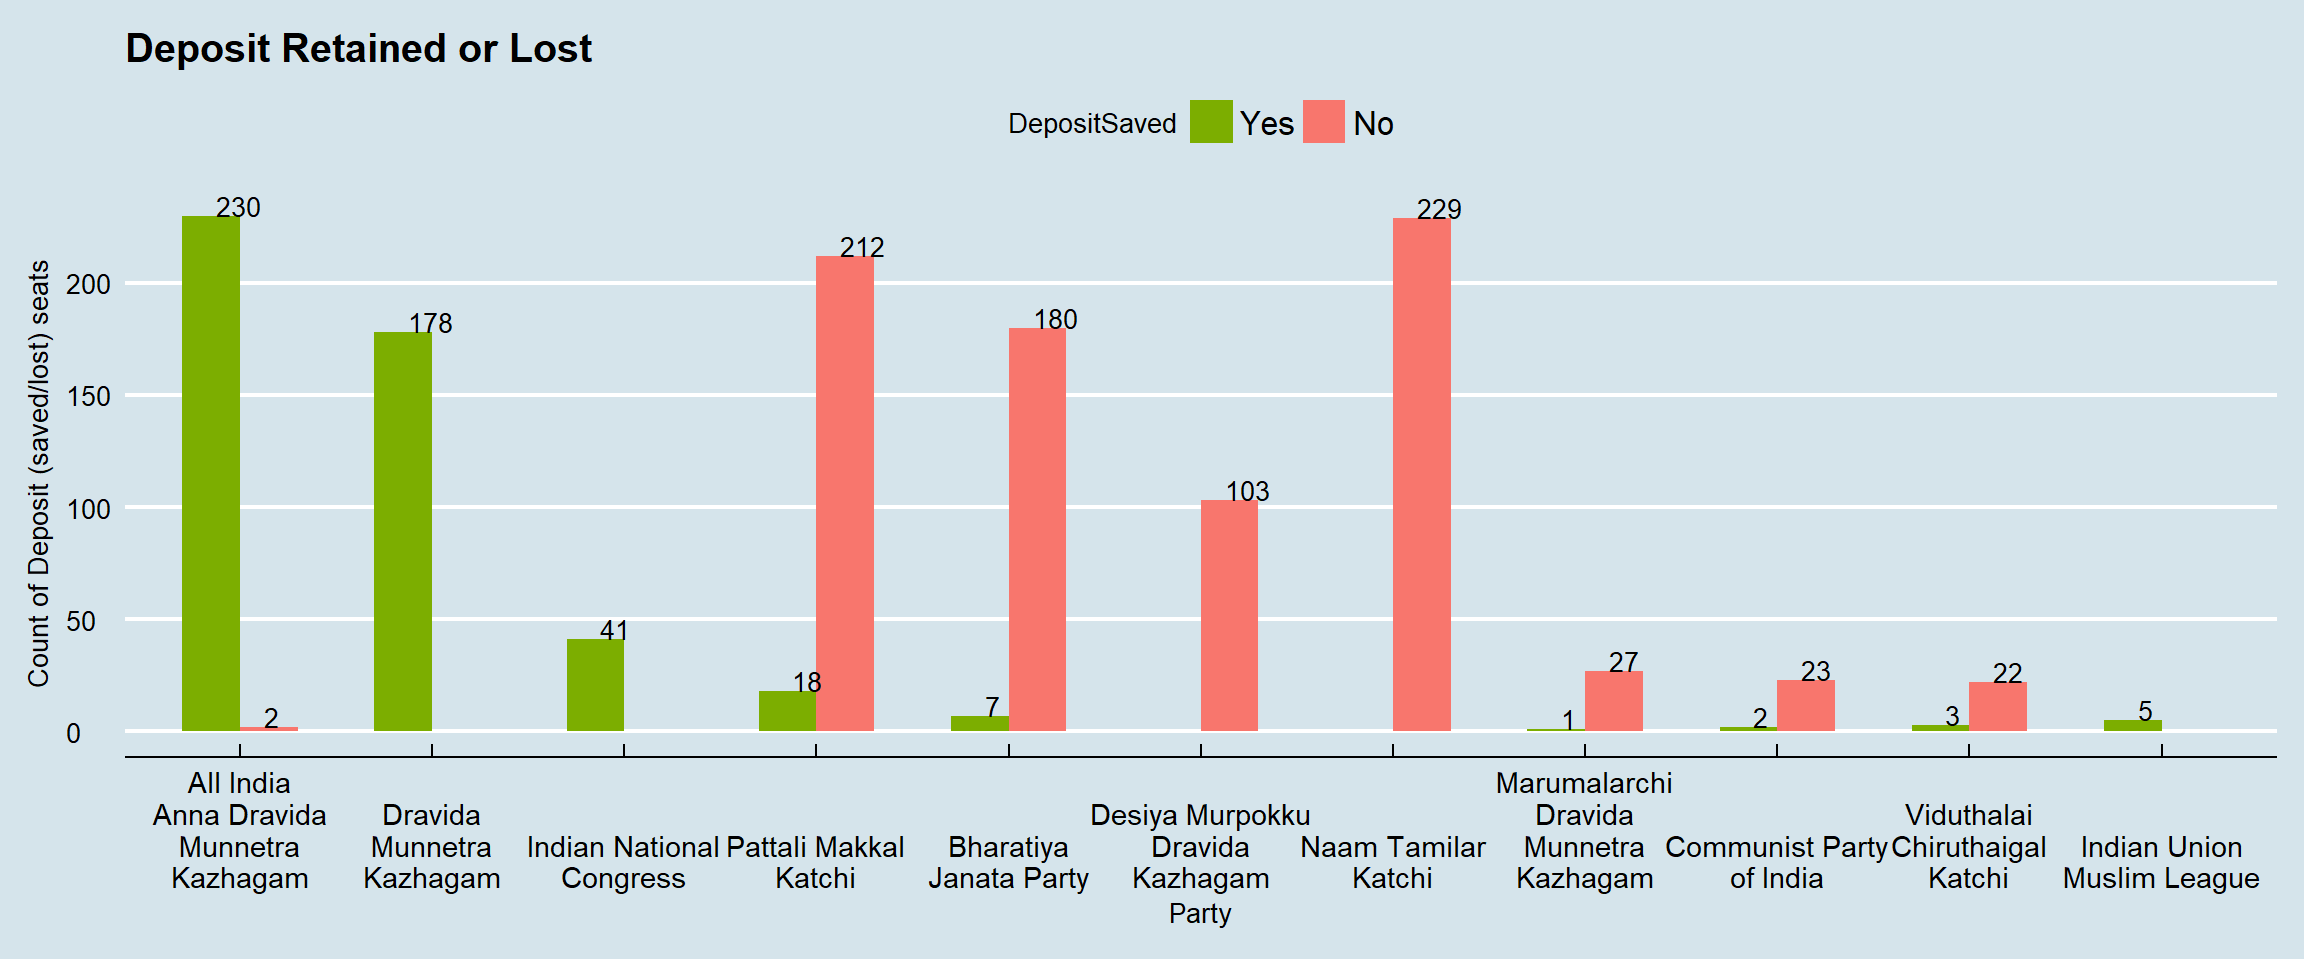
Surprisingly, even the winning party AIADMK lost its deposit in 2 (out of 232) seats it contested. For almost all trailing parties, it’s mostly loss failing to win trust of even a sixth of voters - they must introspect on how to catch the imagination of voters in a fruitful manner in future.
In-depth look at vote-share numbers
One big surprise last year was when AIADMK proved most exit-poll predictions wrong. Given the difference in final seats tally, one would expect vote-share pattern to vary widely between AIADMK and DMK. In the plot of vote-share distribution below, one can see vote-share patterns weren’t much different between the two.
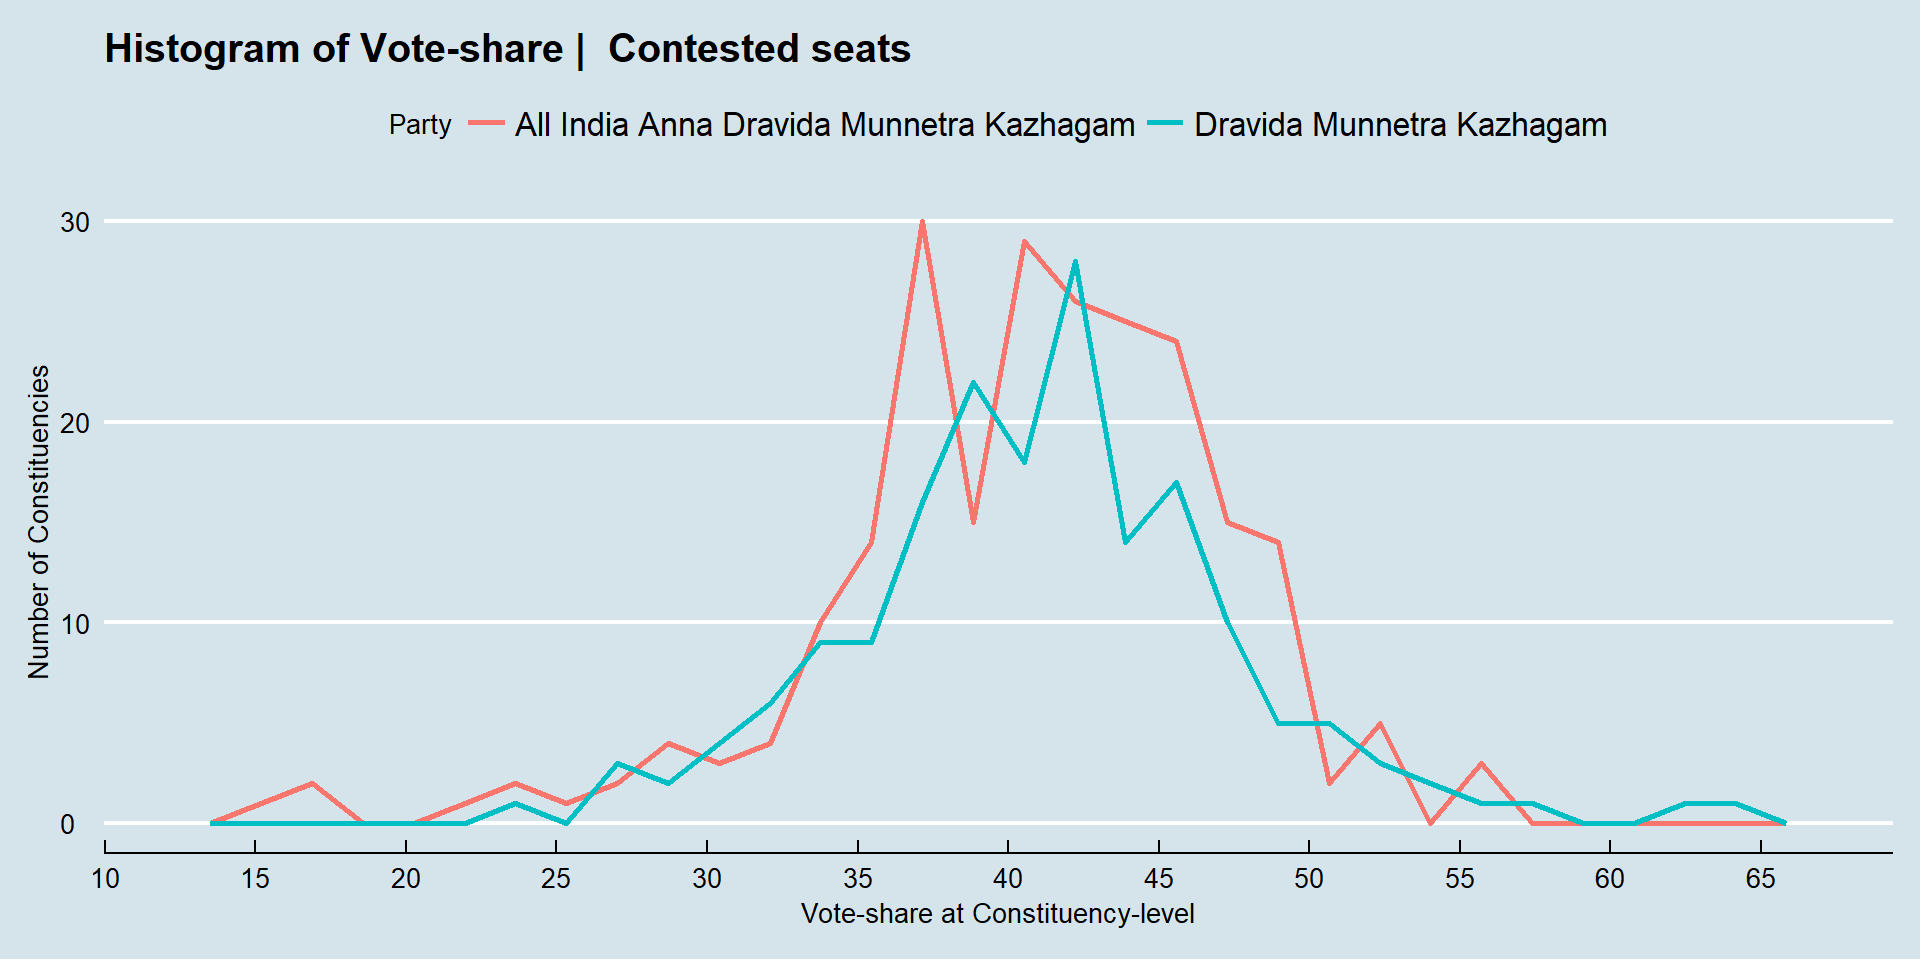
Except for difference in number of seats contested, both AIADMK and DMK fared almost similar in terms of how vote-share numbers were distributed across constituencies contested.
After Normalizing:
Difference in number of Seats contested (DMK-INC alliance seat sharing) seems to distort our visual interpretation. Let’s look at smoothed version of the histogram after normalizing for difference in number of contested seats.
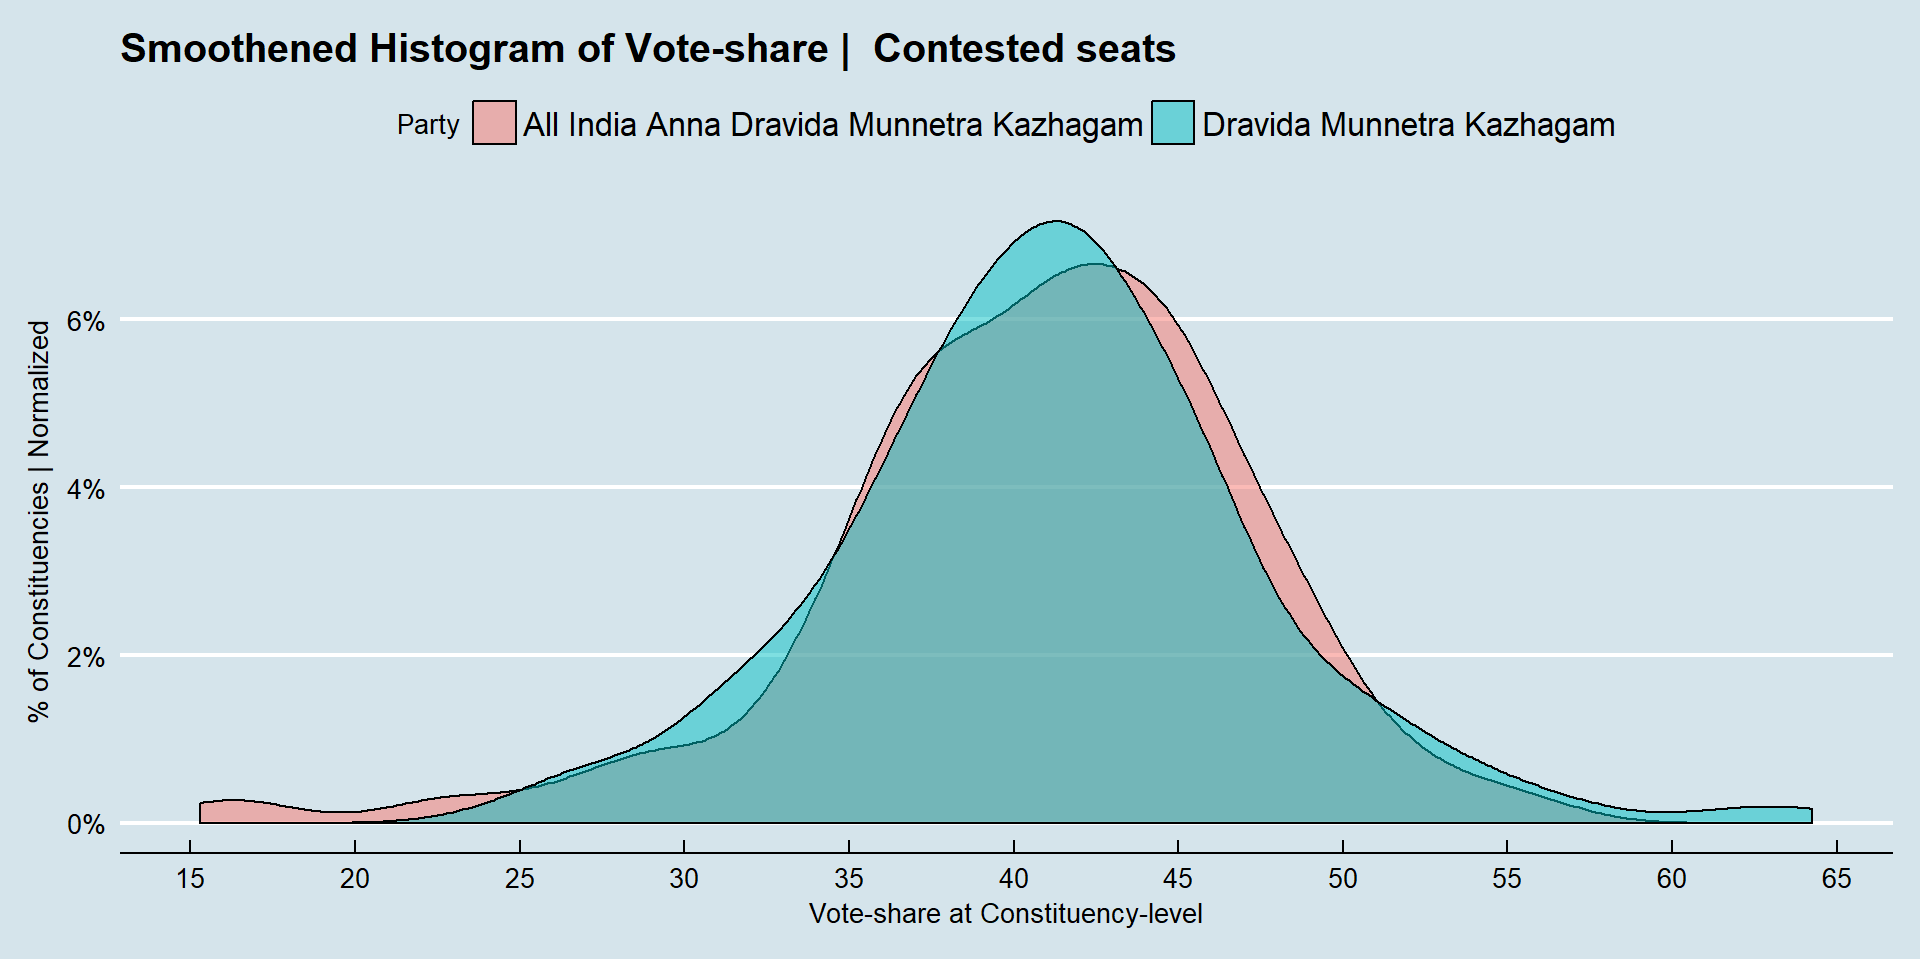
It’s clear that both AIADMK, DMK had similar vote-share distribution in aggregate; also DMK had spectacular show in few seats (more than 60% vote-share) and AIADMK had very bad outcome in few seats (less than 20% vote share). Despite such close performance numbers, how did DMK lose? Is it due to seat-sharing with its ally INC? Let’s look further.
Adding INC!
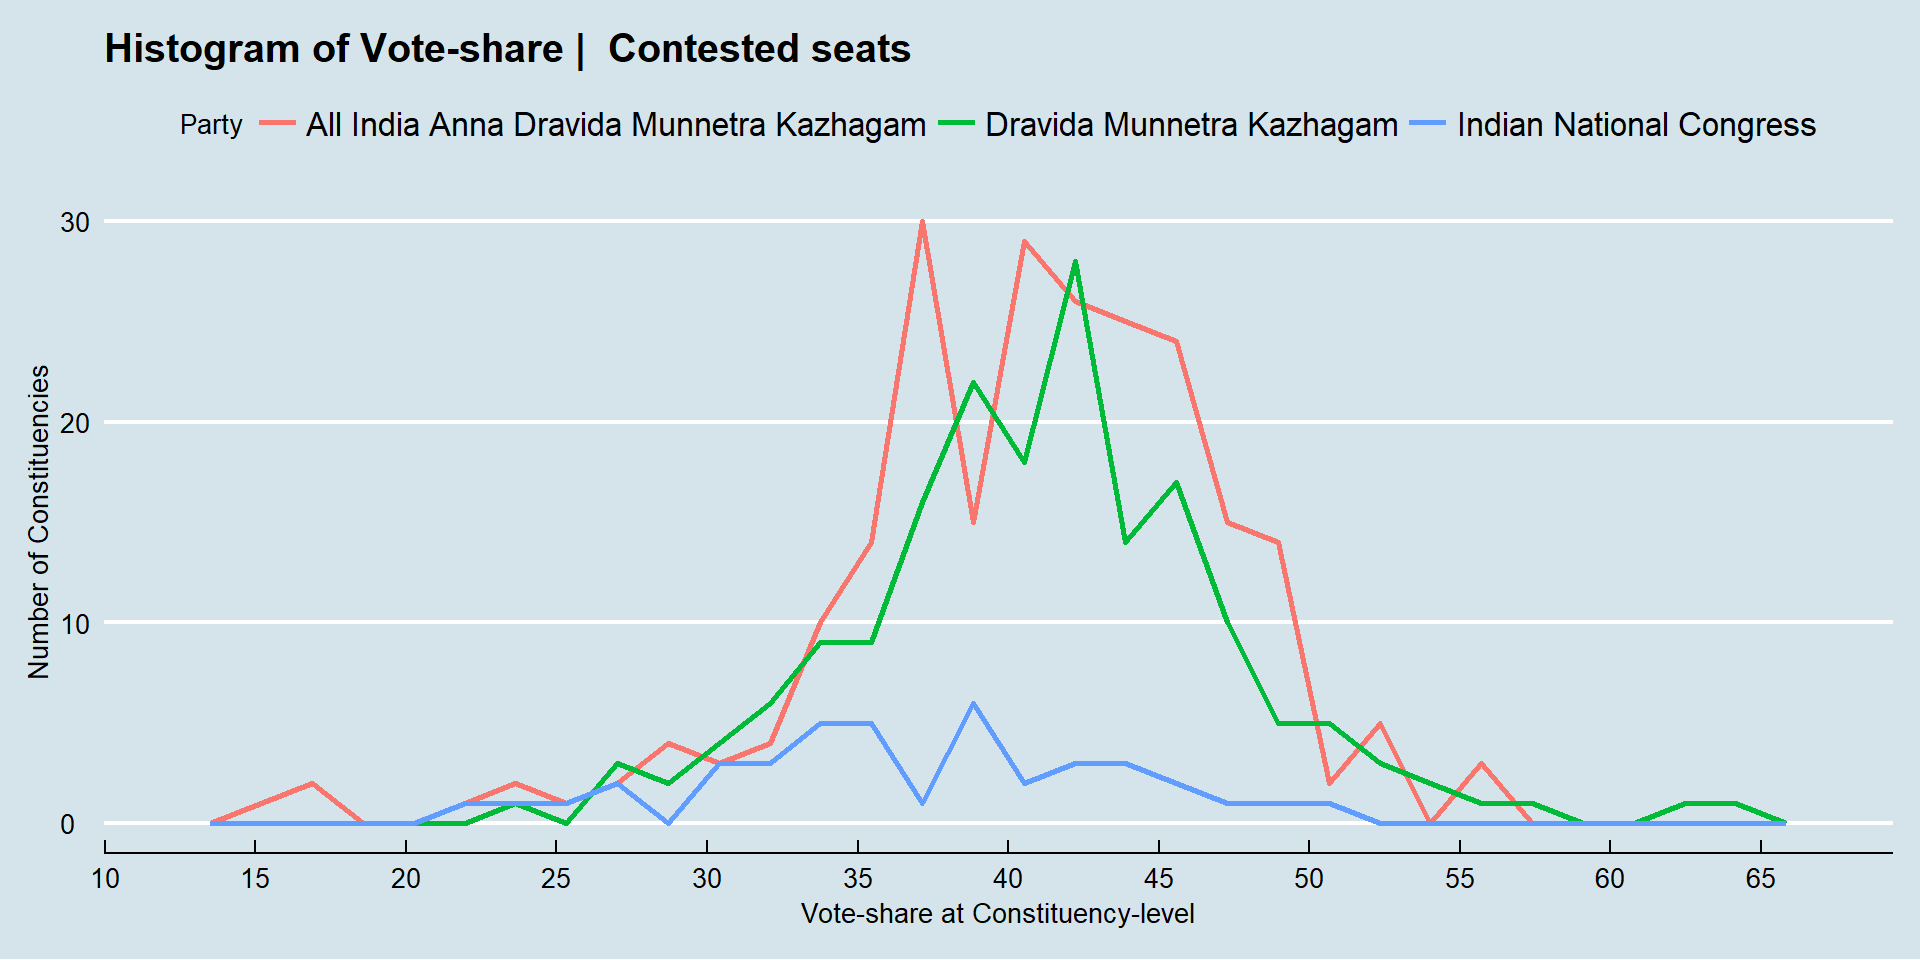
Looking at vote-share in seats contested by all 3 parties, it’s clear that INC performed worse with far less vote-share when compared to AIADMK and its ally DMK.
After Normalizing:
For easy interpretation, let’s look at smoothened histogram of all 3 parties, after normalizing for difference in number of seats contested.
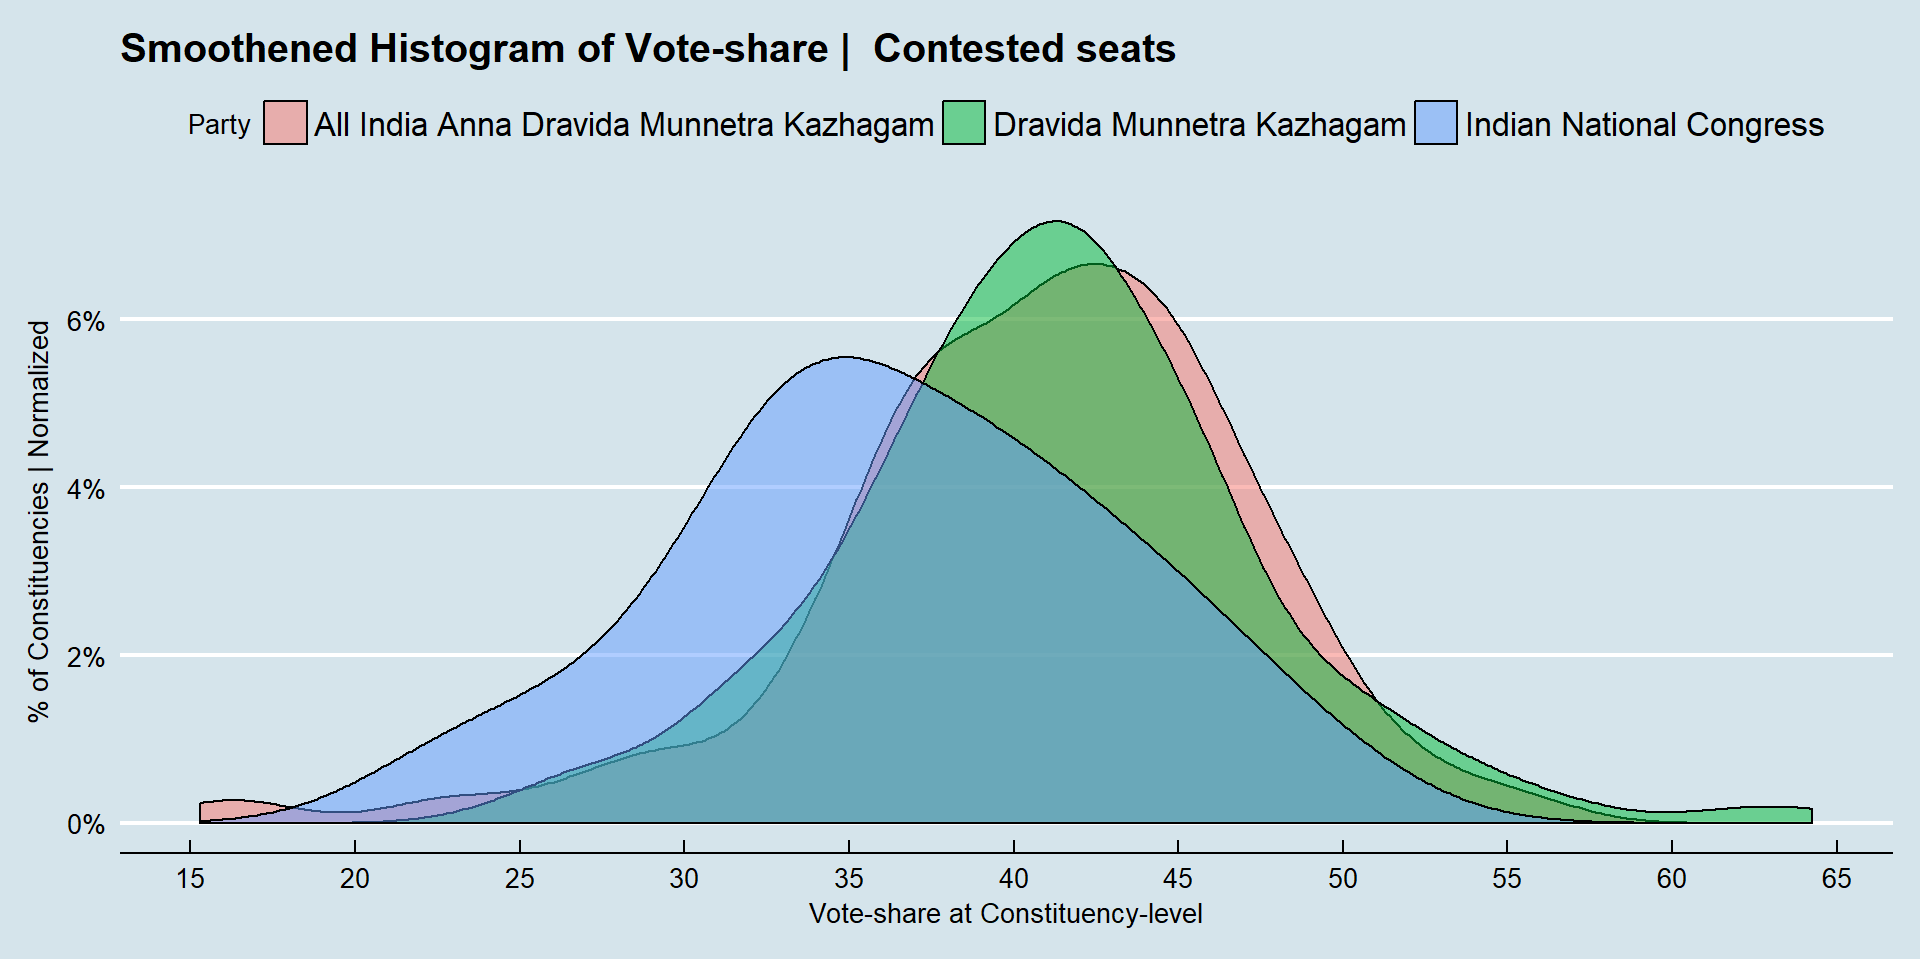
It’s clear that, on an average, INC scored worse vote-share numbers when compared to AIADMK and DMK; this lends credence to the theory that DMK lost much from INC seat-sharing (than what it’d have managed without such seat-sharing)
Vote-share of winner in each constituency
For a change, let’s look at vote-share in winning constituencies i.e. wherever the parties won, did they win with big difference (or) they were just marginally better than runner up.
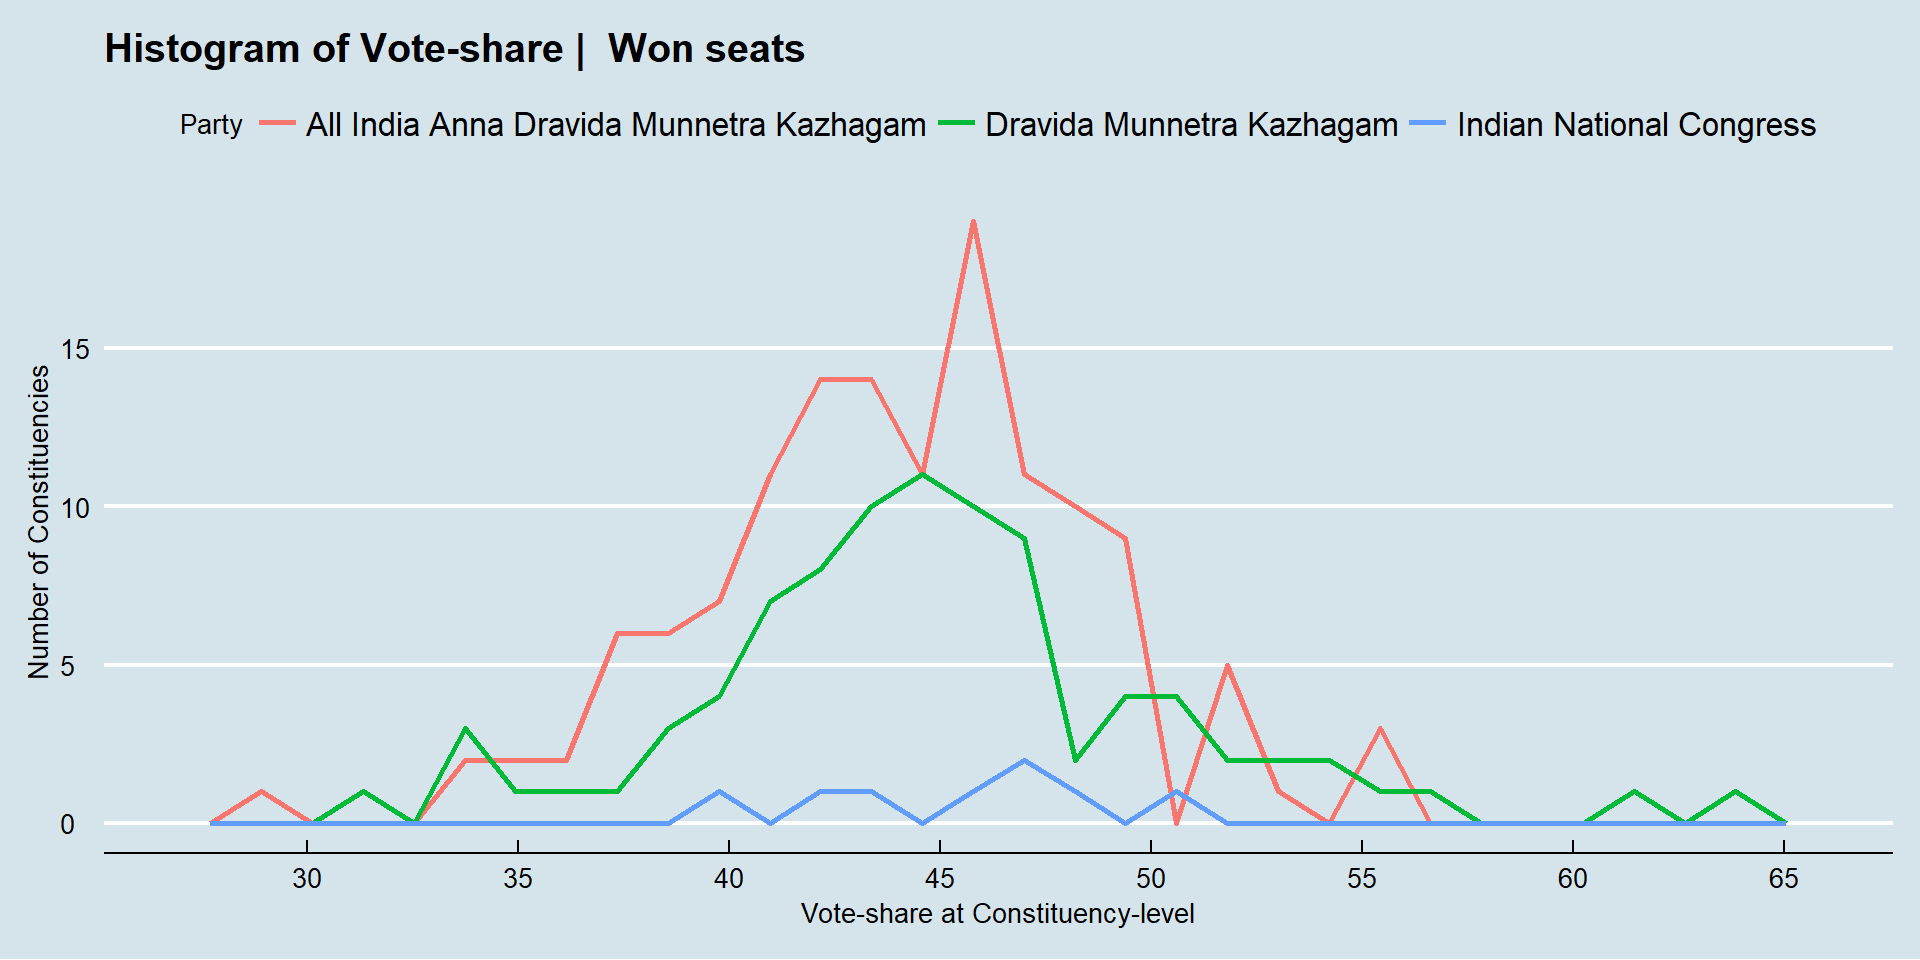
INC surprisingly has won few seats with very good vote share numbers than average vote share of AIADMK or DMK - still they lost terribly in most other seats they contested.
After Normalizing:
Let’s look at at smoothened histogram after normalizing for difference in seats won.
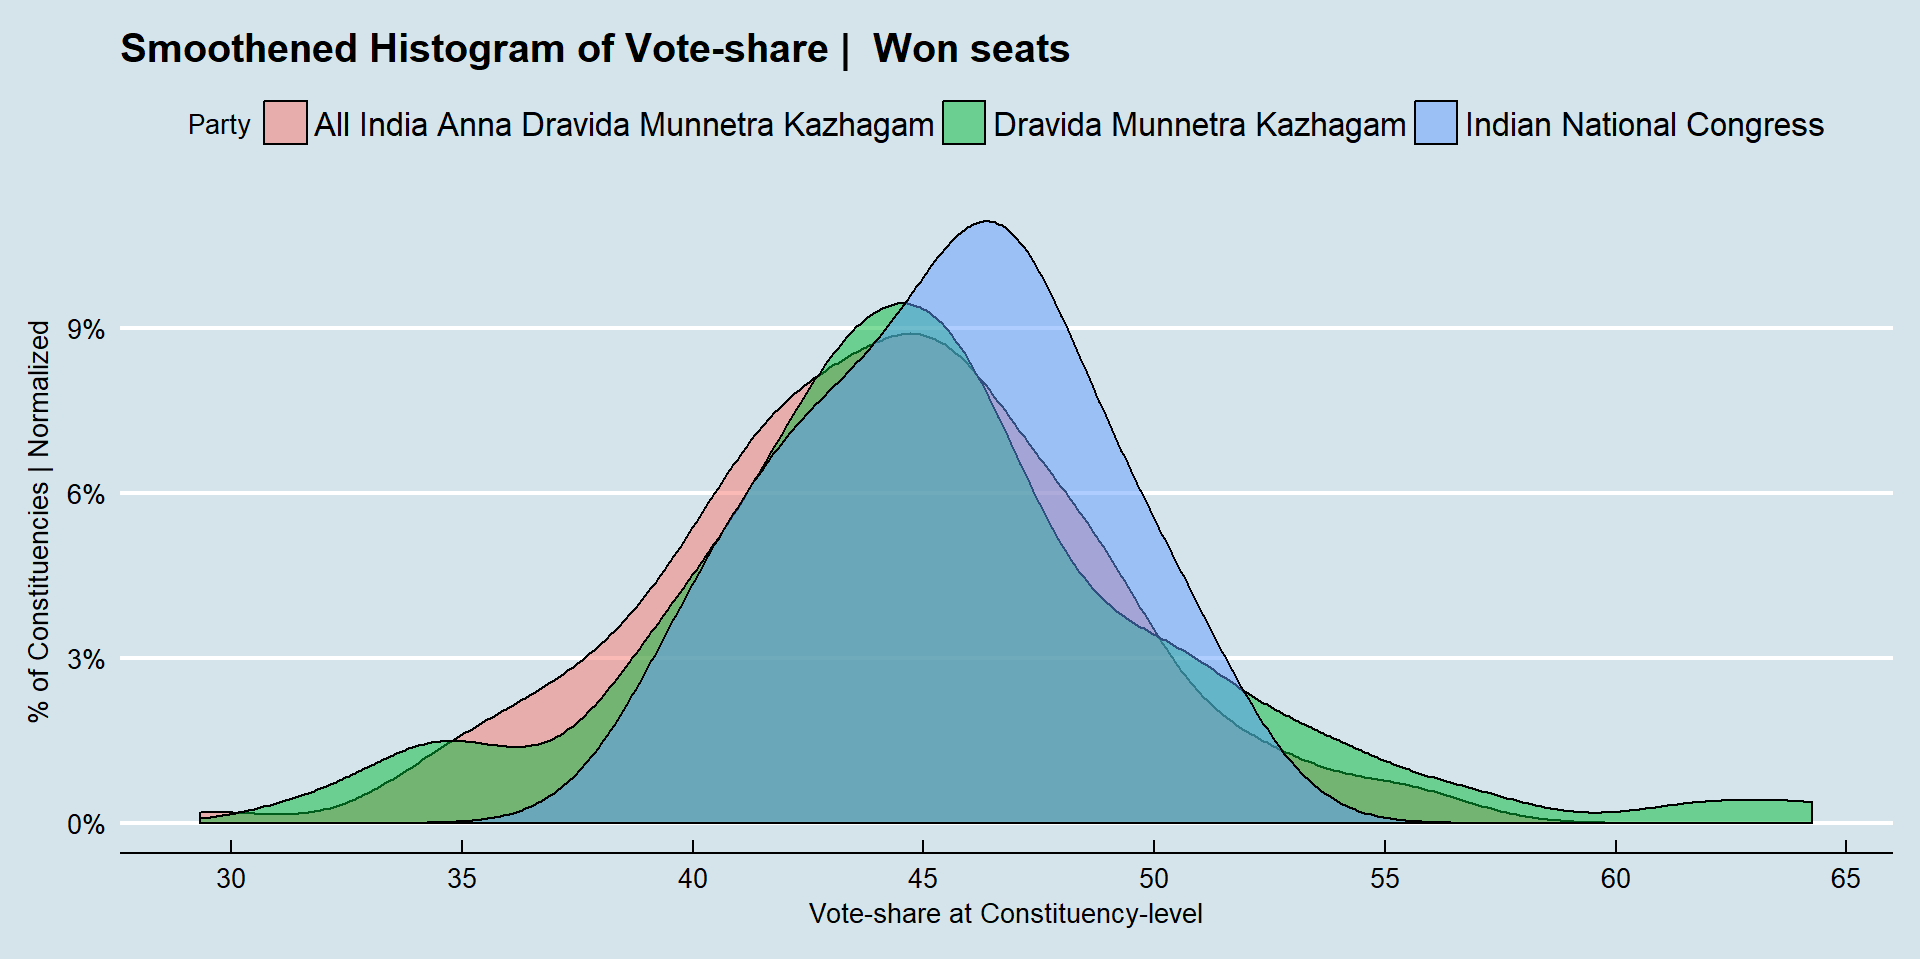
It’s same observation for INC - wherever it won, it has done so with better vote share average than DMK and AIADMK. Whereas, wherever it lost, it had lost with much worse vote-share than top two parties, on an average. (8 seats Won, 33 Lost)
Results in 232 Constituencies
Below map gives a complete snapshot of election outcome, showing Winning party in each constituency. (You can hover mouse over different constituencies for more info. Desktop-version is recommended for better reading. If you are interacting with map in a hand-held device and info-popups on the map aren’t disappearing automatically, please tap outside colored-tiles to clear the info-popups)
Summary
Quote from an editorial by Gopalkrishna Gandhi in The Hindu.
The Dravidian movement cannot be allowed to become a chapter in history books. Not because that movement is hankering for a life beyond its natural span but because we, as a nation and a peoplehood, cannot afford to squander such a bequest. - Breathe in the spirit of 1967 [ The Hindu ]
It’s clear that barring INC alliance seats, AIADMK and DMK had close battle in May 2016 elections - this leaves Opposition Party DMK to do lot of introspection on their INC alliance strategy and way forward. That said, the looming worry in TN voter’s mind today is unexpected demise of AIADMK leader J Jayalalitha in December 2016, leaving no strong second tier leader; this has clearly led to an ugly power-struggle between two AIADMK factions.
Many questions thus arise: would the current Government finish its term of 5 years or collapse mid-term leading to fresh-elections. In the case of re-election, would AIADMK still have its appeal in the absence of J Jayalalitha. As national party BJP tries hard to establish its foothold in relatively well-governed TamilNadu, what will be the future of Dravidian politics (in power since 1967) and its foundations in federalism principles.
On the other hand, what cause or ideology the emerging parties stand for: are their motivations only to arouse voters’ passions with caste, religion, racial issues (or) aligned with long-term interests of TamilNadu? Would such parties be better off focusing their energy on a small number of winnable seats or spreading them too thin across the State? Let’s wait and watch!

