
When it comes to discovering or consuming real-time content, Twitter is the place to be; be it sending out ‘Tweets’ real-time, or discovering latest online ‘Trends’ anywhere, or ability to begin a ‘conversation’ with anyone, Twitter does it all. In fact, Twitter Management wrote this in their letter to shareholders last year.
We’re focused now on what Twitter does best: live. Twitter is live: live commentary, live connections, live conversations. Whether it’s breaking news, entertainment, sports, or everyday topics, hearing about and watching a live event unfold is the fastest way to understand the power of Twitter.
Twitter has always been considered a “second screen” for what’s happening in the world and we believe we can become the first screen for everything that’s happening now. And by doing so, we believe we can build the planet’s largest daily connected audience. A connected audience is one that watches together, and can talk with one another in real-time. It’s what Twitter has provided for close to 10 years, and it’s what we will continue to drive in the future
Embedded in a Twitter User’s Social-graph is a wealth of information on user’s likes and interests, and also implicit social-circles. Unlike Facebook or LinkedIn, the uniqueness of Twitter is in its ‘Follow’ structure - where any can follow any without they knowing each other. This directed social-graph, when methodologically summarized, can reveal interesting information on the most influential/central friends in one’s network and also help enrich one’s Twitter experience by surfacing implicit social-circles in the network.
In this blog, we’ll look into below topics:
- Extract the ego-network of ‘self’ using Twitter API
- Identify the influential nodes using ‘Page Rank’ formulation
- Identify implicit clusters formed
- Recommend new friends to follow on the basis of influential-nodes in cluster of interest
Note 1: This analysis is limited to ego network i.e. the focal node (ego: here the self-node) and the nodes to whom ego is directly connected to (alters) plus the ties, if any, among the alters.
Note 2: Complete Jupyter Notebook with Python source-code and intermediate-outputs are posted here. This blog includes only snippets of Python code. Plots and tables are redrawn/re-rendered in R while composing this R Markdown document.
1. Extract social-graph strucutre using Twitter API
Twitter API is used to extract the data of ego-network i.e. the nodes followed by self (that’s me), and first-degree ‘Follows’ of those nodes. This Graph of (Vertices, Edges) is used to build an adjacency matrix.
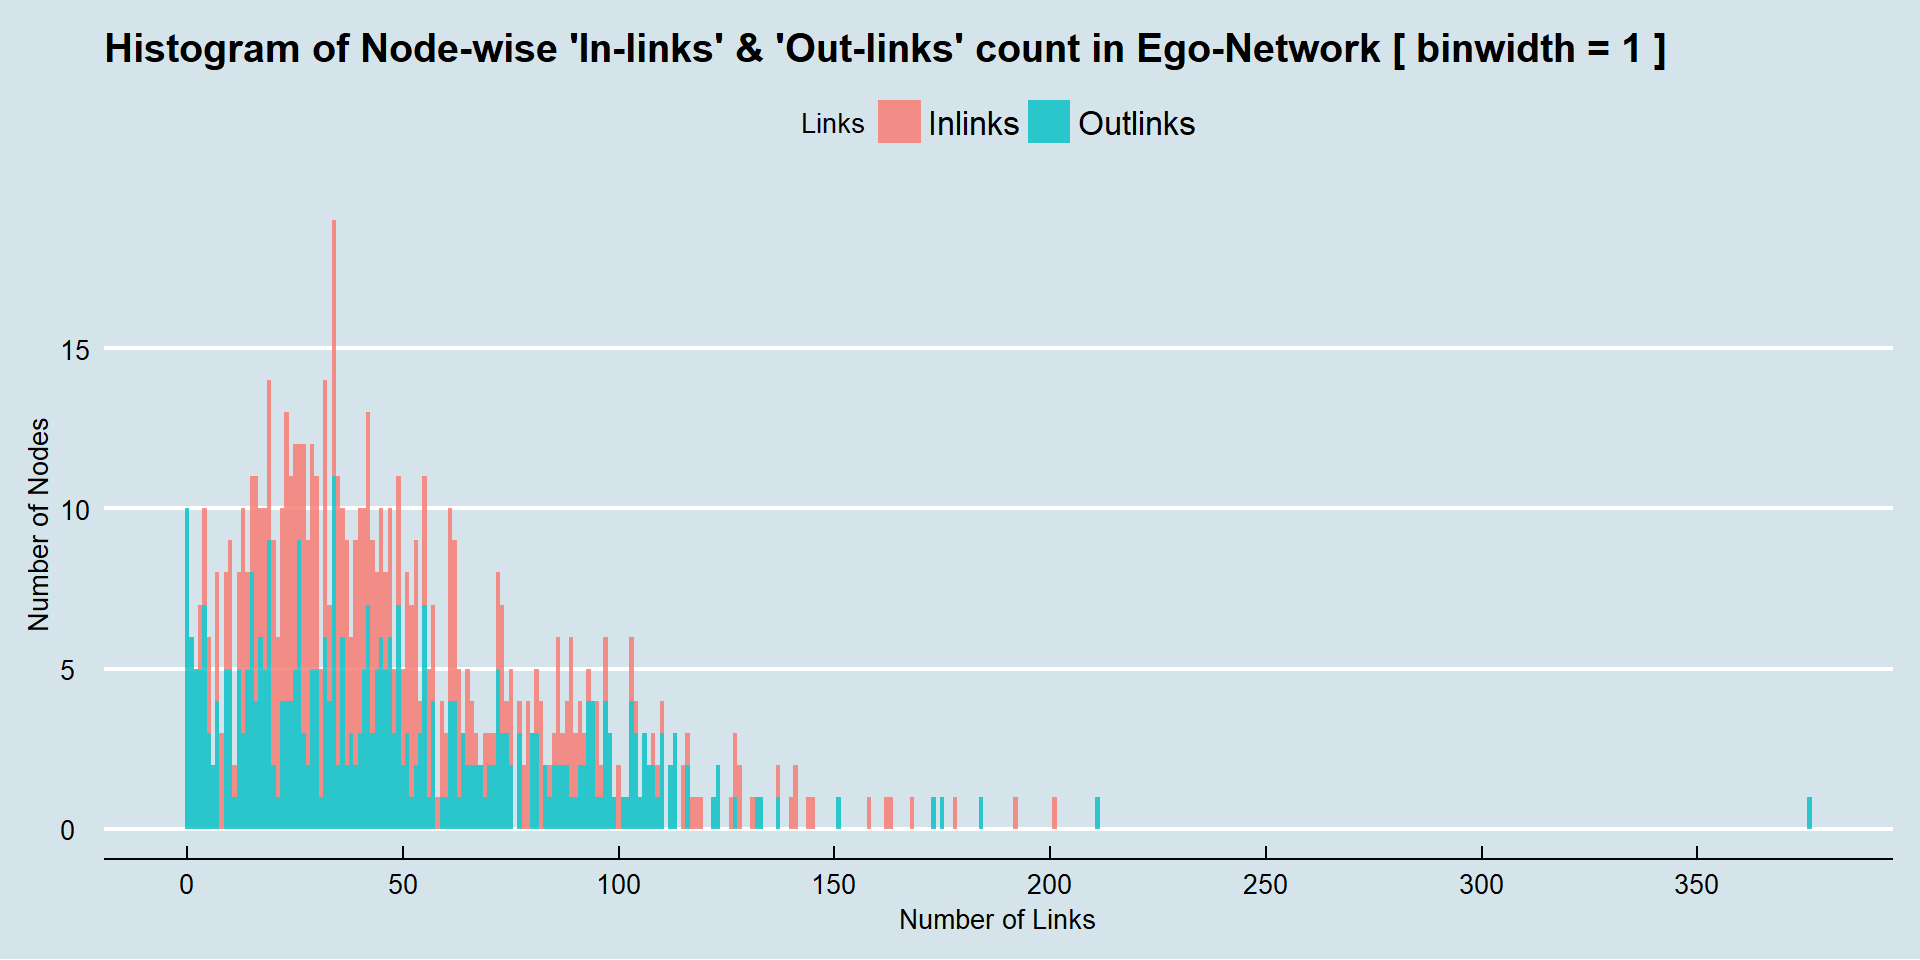
2. Identify influential friends using ‘Page Rank’ formulation
From the adjacency matrix, we can create a column-stochastic matrix (aka Markov transition matrix in random-surfer model) such that, a column with m outlinks will have 1/m as value in respective m cells.
binaryMap_cfr      = binaryMap_rfc.transpose()            # column-values: Outlinks
binaryMap_cfr_norm = binaryMap_cfr / binaryMap_cfr.sum(axis = 0)
colStochMatrix = np.matrix( binaryMap_cfr_norm.fillna(0)) # column-stochastic-matrix
Initialize PageRank vector such that all nodes have equal PageRank score, adding upto 1.
pageRankVector = np.matrix([1.0/len(index)] *  len(index)) # iniitialize page-rank-vector
pageRankVector = pageRankVector.transpose()                # transpose to column-vector
On applying Transition-matrix transformation iteratively on PageRank vector, vector will eventully converge such that: Matrix.Vector = Vector. Equivalently, this is eigen-vector formulation with PageRank vector being the principal eigen-vector corresponding to eigen-value 1 [Since it’s a column-stochastic matrix, principal eigen-value is 1].
Note : To understand how PageRank works, this interactive tutorial from Setosa is a good place to start.
while epsilon > (1.0/(10**16)):
    pageRankVectorUpdating = colStochMatrix * pageRankVector * beta

    # re-insert leaked page-ranks
    S                      = np.array(pageRankVectorUpdating).sum()
    pageRankVectorUpdated  = pageRankVectorUpdating +
               (1 - S) * (1.0/len(index)) * np.ones_like(len(index))

    # compute the squared-difference and check for convergence
    error                  = np.array(pageRankVectorUpdated - pageRankVector)
    epsilon                = np.sqrt((error *  error).sum())
    pageRankVector         = pageRankVectorUpdated
Sum of Page-Rank Scores: 1.0
Converged in 58 iterations
2a. Histogram of PageRank scores
Let’s visualize distribution of scaled PageRank scores (scaled such that nodes have an average-score of 1). The plot gives an idea of how influential are the nodes, with respect to an average node (of say PageRank score = 1).
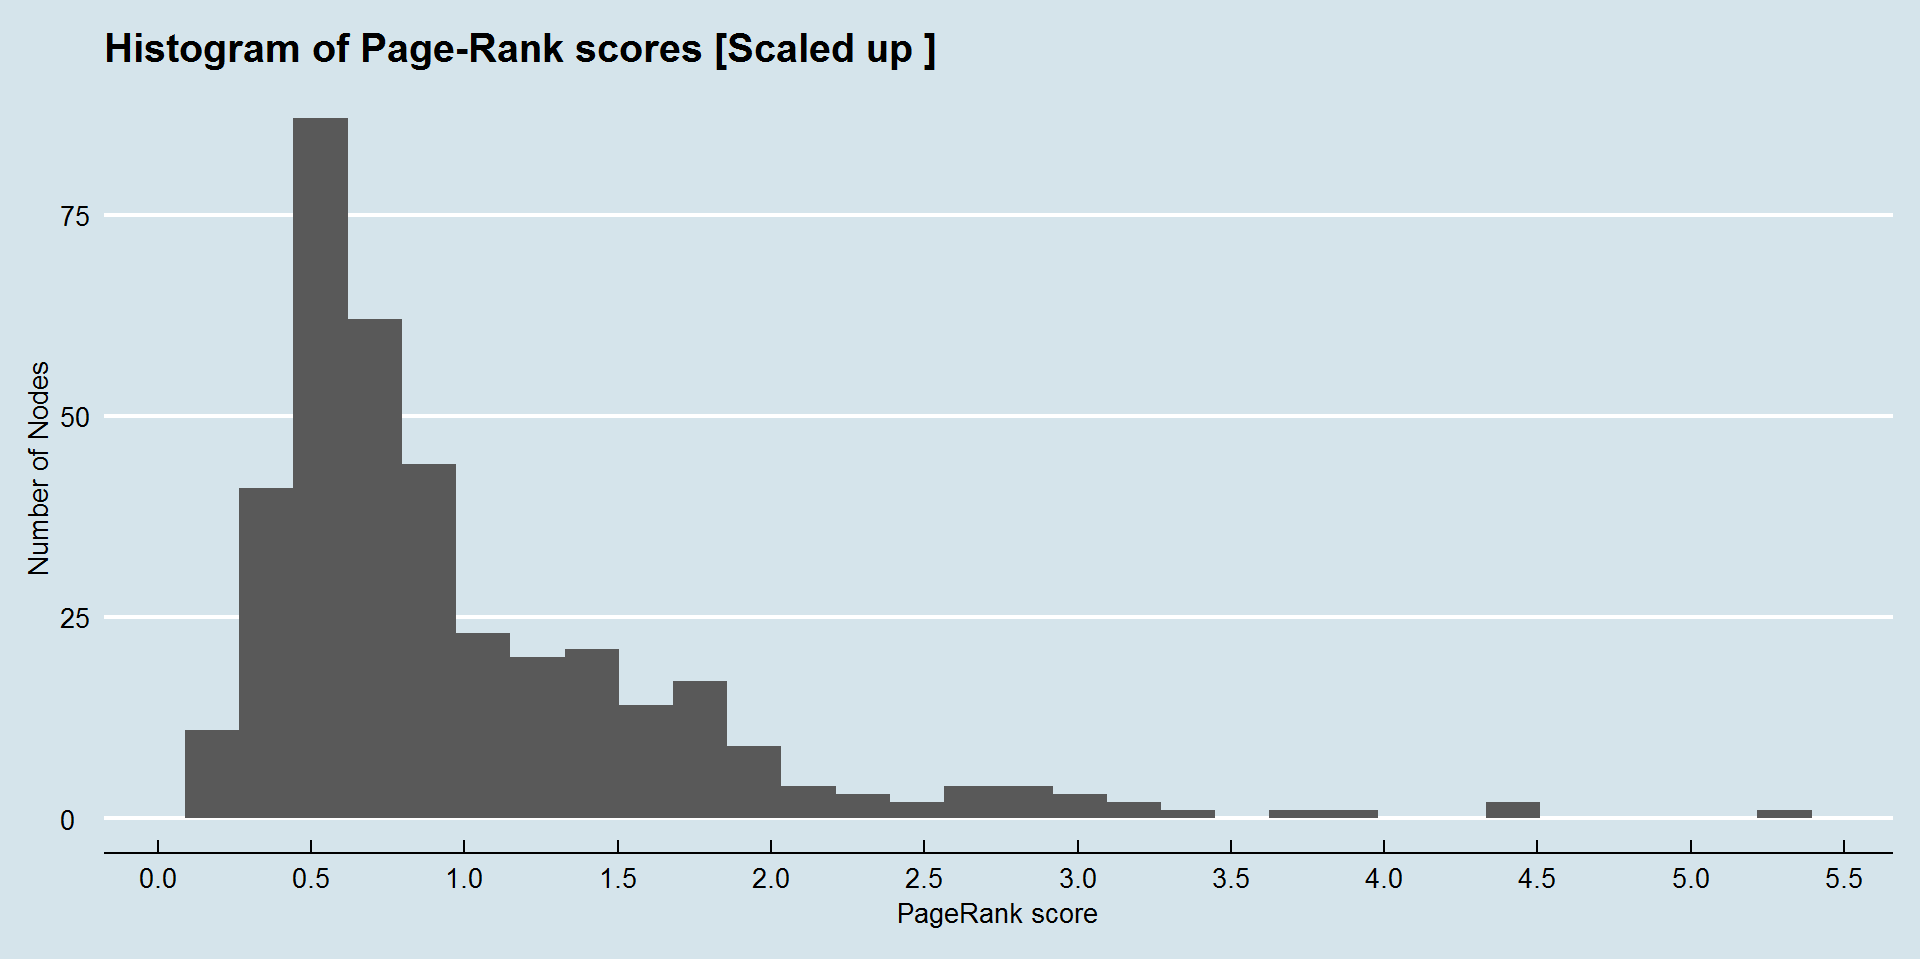
Most influential nodes, by PageRank:
| PageRank | UserName | FullName | Inlinks | Outlinks | Followers | Friends | Location |
|---|---|---|---|---|---|---|---|
| 0.014 | elonmusk | Elon Musk | 201 | 4 | 9 M | 41 | Boring |
| 0.012 | BillGates | Bill Gates | 168 | 16 | 35 M | 183 | Seattle, WA |
| 0.012 | pmarca | Marc Andreessen | 192 | 24 | 645 K | 13952 | Menlo Park, CA |
| 0.010 | Snowden | Edward Snowden | 97 | 0 | 3 M | 1 | |
| 0.010 | timoreilly | Tim O’Reilly | 178 | 132 | 2 M | 1709 | Oakland, CA |
Summary of Top nodes, by PageRank:
| 1 | 2 | 3 | 4 | 5 | 6 |
|---|---|---|---|---|---|
| Elon Musk | Reid Hoffman | Sam Altman | Tim Urban | Microsoft Research | Brian Chesky |
| Bill Gates | Bill Gurley | Steven Levy | Joi Ito | John Markoff | Max Roser |
| Marc Andreessen | Eric Schmidt | Chris Anderson | Benedict Evans | Neil deGrasse Tyson | Bradley Horowitz |
| Edward Snowden | Paul Graham | Hilary Mason | Brad Stone | Charlie Rose Show | Steven Sinofsky |
| Tim O’Reilly | Vinod Khosla | OpenAI | NassimNicholasTaleb | Bill Gross | Gabe Rivera |
| WIRED | Om Malik | Steve Case | Josh Kopelman | danah boyd | Walt Mossberg |
| Nate Silver | TechCrunch | Sundar Pichai | DAVE MORIN | Pierre Omidyar | Steven Pinker |
| Chris Dixon | Ben Horowitz | Patrick Collison | Hunter Walk | Emily Chang | Keith Rabois |
| Fred Wilson | Kara Swisher | Max Levchin | Y Combinator | dj patil | Andrew Ng |
| Ev Williams | Chris Sacca | Nick Bilton | Lessig | Ben Thompson | Glenn Greenwald |
3. Identify implicit clusters
Ideally, the number of clusters are decided using a plot of within-cluster sum-of-squares-of-distances vs number of clusters. Here for simplicity, we use a simple heuristic to fix the number of clusters in advance (~ 10 clusters)
Here we are more interested in clustering behavior which surfaces from who-follows-me (network-driven) graph, rather than who-do-I-follow (self-driven). So the plan is to represent nodes as Observations and whether other nodes follow them or not (1 or 0) as Features (One Observation per row, and one Feature per column) Thus the input matrix must be such that any value in cell implies whether node in the column follows node in the row.
3a. K-Means clustering
K Means is a point-assignment based clustering-algorithm: here we start with k points chosen randomly as centroids and then assign the remaining points to k centroids by using certain distance measure (Euclidean / Cosine / Jaccardi). Then we compute new centroids, re-assign remaining points and repeat, until centroids converge.
est = KMeans(max_iter = 100000, n_clusters = n_clusters, n_init = 200, init='k-means++')
results_df['kmeans'] = est.fit_predict(binaryMap_cfr)| 0 | 1 | 2 | 3 | 4 | 5 | 6 | 7 | 8 |
|---|---|---|---|---|---|---|---|---|
| Edward Sno | Tim Urban | John D | Hilary Mas | OpenAI | Elon Musk | WIRED | Mike Bosto | NassimNich |
| Nate Silve | Tim Ferris | Lynn Chern | dj patil | Microsoft | Bill Gates | Eric Schmi | Gilad Lota | Neil deGra |
| Sundar Pic | GV | Ben Hamner | Jeff Hamme | Andrew Ng | Marc Andre | TechCrunch | Jeffrey He | Max Roser |
| Patrick Co | Mike Bloom | David Smit | Drew Conwa | Yann LeCun | Tim O’Reil | Steven Lev | Martin Wat | Steven Pin |
| Nick Bilto | Garry Tan | Fernando P | Wes McKinn | Google Res | Chris Dixo | Chris Ande | Andrew Gel | Glenn Gree |
| Benedict E | Joe Gebbia | Andreas Mu | Monica Rog | Sebastian | Fred Wilso | Steve Case | Fernanda V | Atul Gawan |
| Brad Stone | Yves Behar | Kaggle | Hadley Wic | Fei | Ev William | Joi Ito | Steven Str | EFF |
| Josh Kopel | Ashlee Van | John Forem | Sean J | Andrej Kar | Reid Hoffm | Lessig | Duncan Wat | Kevin Kell |
| DAVE MORIN | Dustin Mos | Jake Vande | Nathan Yau | Shivon Zil | Bill Gurle | John Marko | Kenneth Cu | Tim Berner |
| Hunter Wal | Balaji S | Scientific | Peter Skom | Pedro Domi | Paul Graha | Bill Gross | Sinan Aral | Edward Tuf |
| * Each column is a unique cluster found by algorithm | ||||||||
| † Nodes arranged such that highest PageRank score is at top |
3b. Spectral clustering
One problem in K-Means algorithm is Curse of Dimensionality i.e. at higher-dimensions (here ~400 dimensions), any metric like ‘Euclidean distance’ or ‘Centre’ would have little meaning in the context of non-convex region.
On the other hand, Spectral Clustering attempts to partition the graph such that number of edges which connect different components are minimized. It uses eign-vector based approach to partition the graph. Below is the output from Spectral Clustering.
spectral = cluster.SpectralClustering(n_clusters=n_clusters,  n_init = 500,
                                          eigen_solver='arpack',
                                          affinity="nearest_neighbors")
spectral.fit(binaryMap_cfr)
results_df['spectral'] = spectral.labels_.astype(np.int)| 0 | 2 | 3 | 4 | 5 | 6 | 7 | 8 | 9 |
|---|---|---|---|---|---|---|---|---|
| dj patil | Lynn Cherny | Tim O’Reill | Nate Silver | Hilary Maso | Elon Musk | Edward Snow | Andrew Ng | Luke Wroble |
| Jeff Hammer | Ben Hamner | Ev Williams | Sundar Pich | Drew Conway | Bill Gates | WIRED | Yann LeCun | Mat |
| Monica Roga | Olivier Gri | Bill Gurley | Patrick Col | Wes McKinne | Marc Andree | Eric Schmid | Fei | Julie Zhuo |
| Peter Skomo | Fernando Pe | Om Malik | Benedict Ev | Hadley Wick | Chris Dixon | Vinod Khosl | Andrej Karp | Jon Wiley |
| Michael E | Andreas Mue | Kara Swishe | Y Combinato | Sean J | Fred Wilson | TechCrunch | Stanford NL | Daniel Burk |
| bradford cr | Jake Vander | Chris Sacca | Emily Chang | Nathan Yau | Reid Hoffma | Chris Ander | John Platt | Braden Kowi |
| Jeremy Howa | Scientific | Steven Levy | Ben Thompso | John Myles | Paul Graham | OpenAI | Richard | Google Desi |
| Mike Olson | Sebastian R | Nick Bilton | Brian Chesk | chris wiggi | Ben Horowit | Steve Case | Oren Etzion | Josh Brewer |
| Anthony Gol | Trey Causey | Josh Kopelm | Steven Sino | Ben Lorica | Sam Altman | Tim Urban | Ian Goodfel | Jake Knapp |
| Joe Hellers | Joshua Bloo | DAVE MORIN | Tony Fadell | Josh Wills | Max Levchin | Joi Ito | Nando de Fr | John Zerats |
| * Each column is a unique cluster found by algorithm | ||||||||
| † Nodes arranged such that highest PageRank score is at top |
Let’s try to assign meaning to algorithmically labeled clusters: We can see that the nodes into Deep Learning have grouped into Cluster 8, Python Machine Learning into Cluster 2, Product-Design into Cluster 9, general Data Science into Clusters 0, 5.
3c. Principal Component Analysis
To handle the Curse of dimensionality problem inherent in higher dimensions, PCA is used to reduce data into fewer dimensions with some loss in variance - this helps in faster and effective computation while running clustering algorithm, as well as better visualizing of data. PCA uses eigen-vector based approach to reduce high-dimensional data.
pca = PCA(n_components=3)
Xproj = pca.fit_transform(binaryMap_cfr)

print("Explained-variance, Proportion of Explained-variance in 3 dims [dim1 dim2 dim3]")
print(pca.explained_variance_, pca.explained_variance_ratio_)
Explained-variance, Proportion of Explained-variance in 3 dims [dim1 dim2 dim3]
[ 7.09266174 3.16212677 1.21891396] [ 0.18363161 0.08186862 0.03155813]3d. Spectral-clustering outcome, visualized in 2 dimensions:
( Pick appropriate ‘Tool’ in the right panel to better interact with plot. Pan: To drag plot-area. BoxZoom: To zoom into a box area WheelZoom: Zoom into mouse-focus area by mouse-scroll)
More on Clustering: http://scikit-learn.org/stable/modules/clustering.html
4. Recommend new friends to follow
Now that we have PageRank of nodes and clusters they belong to, we can ask for recommendations on the basis of nodes followed by top-ranked nodes, across graph or specific to a cluster of interest.
4a. Who To Follow | Using full Ego-Network
| FullName | Freq | Created | Followers | Friends | Location | UserName |
|---|---|---|---|---|---|---|
| Medium | 67 | May-12 | 2 M | 78 | San Francisco, | Medium |
| Barack Obama | 67 | Mar-07 | 89 M | 629775 | Washington, DC | BarackObama |
| Aaron Levie | 52 | Mar-07 | 2 M | 423 | Palo Alto | levie |
| Clay Shirky | 51 | May-07 | 366 K | 749 | Shanghai | cshirky |
| Mitch Kapor | 47 | Mar-07 | 116 K | 553 | Oakland | mkapor |
| The New York Times | 45 | Mar-07 | 37 M | 894 | New York City | nytimes |
| jack | 45 | Mar-06 | 4 M | 2791 | California, USA | jack |
| marissamayer | 44 | Nov-08 | 2 M | 350 | San Francisco, | marissamayer |
| Stewart Butterfield | 43 | Sep-06 | 65 K | 2418 | West coast | stewart |
| Anil Dash | 40 | Dec-06 | 613 K | 4684 | NYC | anildash |
| * Sorted by Frequency (Number of friend-nodes who follow the new node) |
4b. Who To Follow | Using Data-Science cluster (from Spectral algo)
| FullName | Freq | Created | Followers | Friends | Location | UserName |
|---|---|---|---|---|---|---|
| Pete Warden | 21 | May-08 | 12 K | 1559 | San Francisco, | petewarden |
| Hanna Wallach | 19 | Sep-12 | 8 K | 795 | Brooklyn, NY | hannawallach |
| Barack Obama | 19 | Mar-07 | 89 M | 629775 | Washington, DC | BarackObama |
| Alex Smola | 19 | Jun-08 | 9 K | 48 | Mountain View a | smolix |
| Hal Daum<e9> III | 18 | Jun-10 | 9 K | 1017 | Washington DC | haldaume3 |
| Chris Diehl | 17 | Apr-08 | 4 K | 999 | San Francisco B | ChrisDiehl |
| Julie Steele | 17 | Mar-08 | 4 K | 913 | NYC and Provide | jsteeleeditor |
| Joseph Adler | 17 | Apr-08 | 2 K | 623 | Silicon Valley | jadler |
| joseph reisinger | 17 | Jul-09 | 2 K | 686 | josephreisinger | |
| Daniel Tunkelang | 16 | Aug-08 | 8 K | 20 | Mountain View | dtunkelang |
| * Sorted by Frequency (Number of friend-nodes who follow the new node) |
4c. Who To Follow | Using Design cluster (from Spectral algo)
| FullName | Freq | Created | Followers | Friends | Location | UserName |
|---|---|---|---|---|---|---|
| Nicholas Jitkoff | 8 | Jan-07 | 5 K | 204 | Palo Alto, CA | alcor |
| John Maeda | 8 | Jul-08 | 439 K | 21724 | WordPressLandia | johnmaeda |
| Joshua Porter | 7 | Mar-07 | 34 K | 817 | Newburyport, MA | bokardo |
| Khoi Vinh | 7 | Dec-06 | 347 K | 2347 | New York, NY | khoi |
| Brett Lider | 7 | Dec-08 | 7 K | 947 | San Francisco, | bl |
| Margaret Stewart | 7 | Mar-07 | 13 K | 862 | Bay Area, CA | mags |
| Paul Stamatiou | 7 | Jan-07 | 34 K | 599 | San Francisco, | Stammy |
| GV Design | 7 | Aug-11 | 18 K | 515 | San Francisco, | GVDesignTeam |
| Marc Hemeon | 6 | Jan-09 | 17 K | 3322 | Southern Califo | hemeon |
| Michael Leggett | 6 | Mar-07 | 8 K | 209 | Seattle | leggett |
| * Sorted by Frequency (Number of friend-nodes who follow the new node) |


5. Social Graph (Nodes, Links) in 3d space (using igraph)
In the PCA section, we saw the nodes visualized in 2D space. igraph module offers richer network-analysis capabilities in R. Let’s visualize nodes in 3D by using igraph and threejs packages in R.
For simplicity, let’s look only at important nodes: say, nodes with >50 inlinks in initial ego-network. Colors correspond to Spectral Clustering output and node-size is proportional to PageRank. Three dimensions from Principal Component Analysis output are used to fix nodes in 3D space.
( Press and hold the left mouse button and move the mouse to rotate the plot. Press and hold the right mouse button to pan. Use the mouse scroll wheel to zoom. Hover mouse-pointer over node-centre to display FullName)